The system began to slow down. Moreover, its clone flies on another host with more tickets. There are no problems in the host - RT itself in ESXI and the virtual machine has 3 GB of RAM allocated. The disks are alive. Sometimes it takes RAM, the top command does not display processes.
Version 4.4
Where to look? What to send?
Hey there,
Performance analysis is hard  What database are you using and can you enable slow-query logging to identify any queries that are taking longer than usual?
When you say a clone on another host - do you mean another VM on the same physical host, or a different ESXi server? I’ve seen very often when vCPUs are over-committed on an ESXi server, you’ll have high CPU ready time on the ESXi layer that doesn’t translate to any obvious performance issue inside the guest. Counter-intuitively, increasing the number of vCPUs allocated to a VM in the hope of increasing performance, can result in reduced performance as the hypervisor scheduler has trouble scheduling the VM with larger vCPUs when under contention.
Hence why I wondered if your clone was on the same ESXi host.
Good afternoon.
Thanks for the reply.
Another ESXI server.
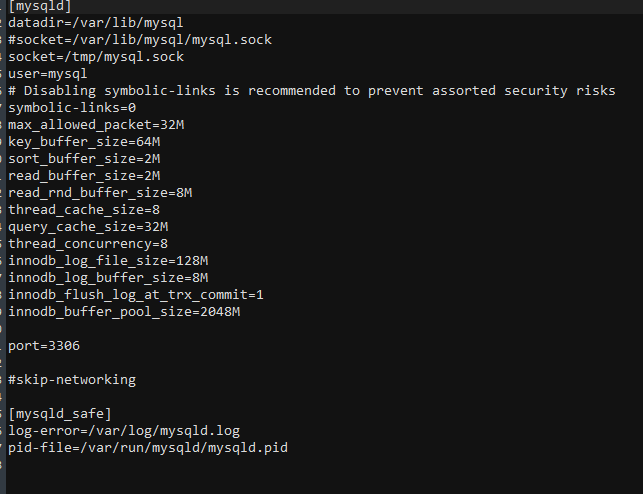
Innodb database
Configs in both RT are the same.
They added both RAM (allocated from the esxi host) and a processor.
It’s like it’s sagging anyway.
Provided that the ESXI host still has plenty of space.
About the magazine I would include, but there is no experience in this.
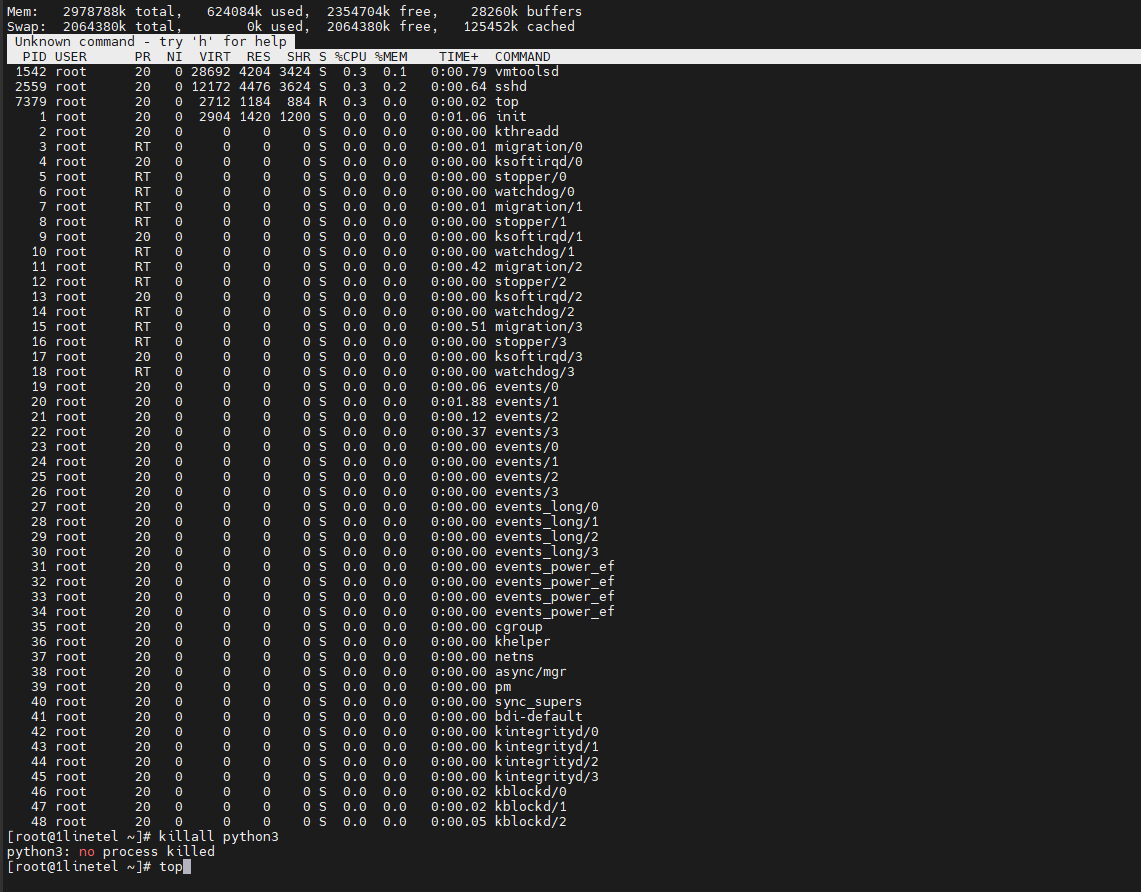
My first thought is, are you watching the load on the server via top command during these slowdowns or are you checking the load on the server once the slowdown is over? Maybe the memory is being used up during peak use time.
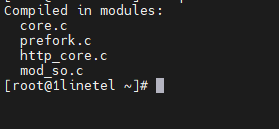
For Apache, are you using MPM Prefork?
How large is your DB? Does RT slow down for specific tasks/actions?
I try to follow throughout the day. The problem is not floating. But constant.
That is, there are gaps, but short-lived.
Apparently we don’t use it.
The base is 3GB on this host - and it slows down terribly.
The base on the host, where it does not slow down, weighs 30 GB - at least she has something.
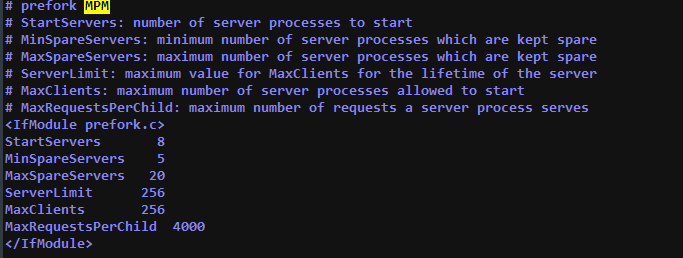
I’d double check Prefork is actually enabled, it likely is but I see this comment:
Apache can run with several different Multi-Processing Modules (MPMs). RT is designed to run only with the prefork MPM. Most Linux distributions today use the event MPM by default, so it is important to make sure Apache is configured to use prefork on your RT server. If you do not use prefork MPM, RT will start okay but fail under production load, either because the web server crashes or performance severely degrades.
In the docs
I want to show you how it looks
Let me remind you that RT, which does not slow down, is a complete copy of what slows down.
We copied the virtual machine and changed the interface.
Correction, Prefork is used.
Hey, I watched the video. I’d recommend enabling slow query logging (something like https://dev.mysql.com/doc/refman/8.0/en/slow-query-log.html) and see if you can identify any queries that are reproducibly slow. Then you can compare that query between servers, or run a slow query throughout the day and measure the performance difference.
It’s going to be one of server side page rendering (CPU), database optimization, disk latency/speed or CPU over-allocation on the underlying ESX server resulting in inefficient use of physical CPU resources (What is VMware CPU Ready? - ESX Virtualization).
What values do I need to analyze?
What would you recommend to specify in logging?
The mysql documentation seems ok, but another example here:
If the slowness is on the ESX / infrastructure side, then you hope to find a slow query logged by mysql that you can repeat while monitoring ESX performance.
If the slowness is due to low memory, swap, slow disk etc, then finding queries that can make those issues more obvious can help to pinpoint the issue. However if it was memory or disk related, I would expect refreshes of the same ticket to be faster. Your video didn’t show the refresh, but I would expect that to be fast on refresh if data is cached in memory.
Just based on the slow ticket load, I’d be suspecting CPU, and if the VM isn’t heavily loaded with other tasks and has 2+ vCPUs, then my guess is the ESXi physical CPUs are overcommitted.


THIS IS HOST ESXI - CPU USAGE IS VERY LOW
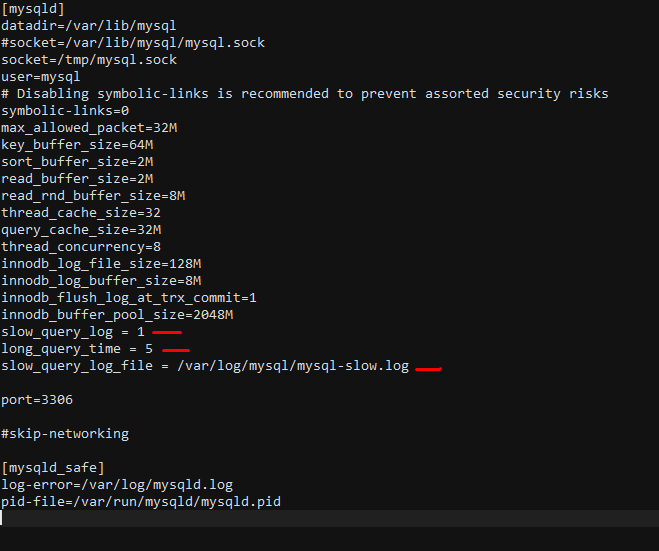
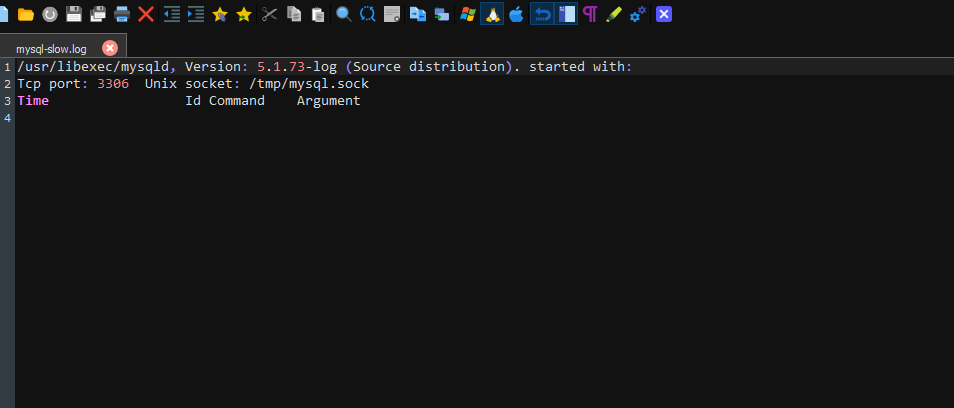
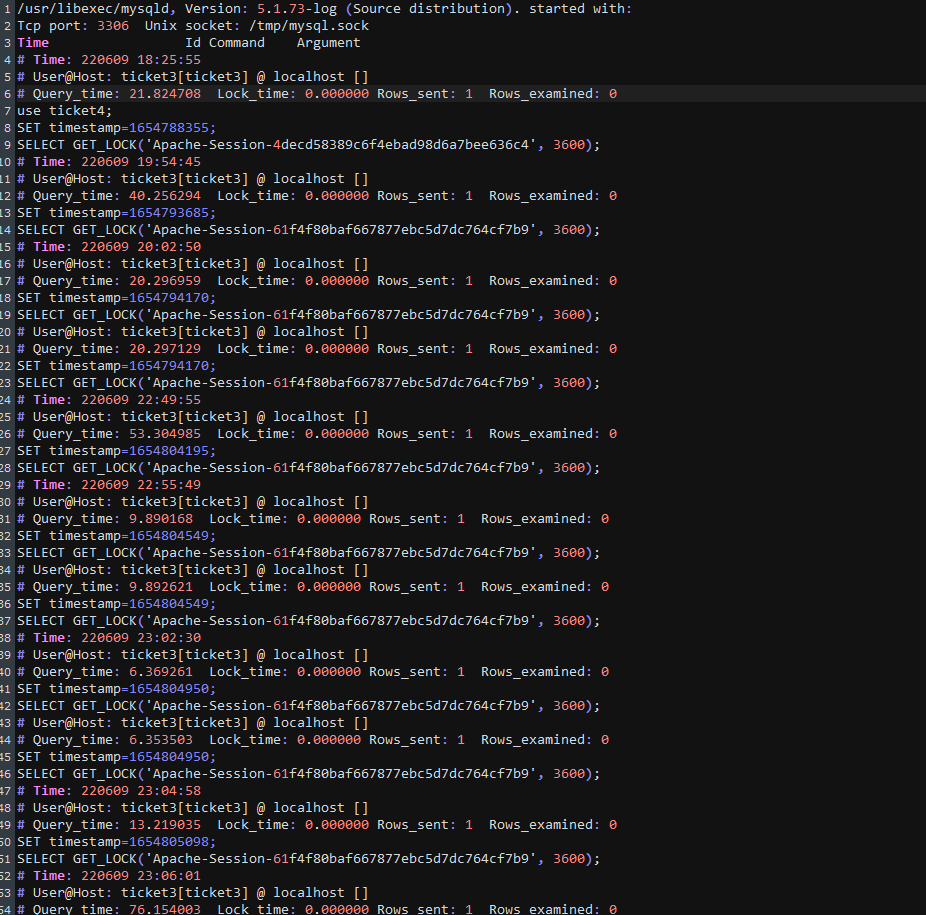
/usr/libexec/mysqld, Version: 5.1.73-log (Source distribution). started with:
Tcp port: 3306 Unix socket: /tmp/mysql.sock
Time Id Command Argument
Time: 220609 18:25:55
User@Host: ticket3[ticket3] @ localhost []
Query_time: 21.824708 Lock_time: 0.000000 Rows_sent: 1 Rows_examined: 0
use ticket4;
SET timestamp=1654788355;
SELECT GET_LOCK(‘Apache-Session-4decd58389c6f4ebad98d6a7bee636c4’, 3600);
Time: 220609 19:54:45
User@Host: ticket3[ticket3] @ localhost []
Query_time: 40.256294 Lock_time: 0.000000 Rows_sent: 1 Rows_examined: 0
SET timestamp=1654793685;
SELECT GET_LOCK(‘Apache-Session-61f4f80baf667877ebc5d7dc764cf7b9’, 3600);
Time: 220609 20:02:50
User@Host: ticket3[ticket3] @ localhost []
Query_time: 20.296959 Lock_time: 0.000000 Rows_sent: 1 Rows_examined: 0
SET timestamp=1654794170;
SELECT GET_LOCK(‘Apache-Session-61f4f80baf667877ebc5d7dc764cf7b9’, 3600);
User@Host: ticket3[ticket3] @ localhost []
Query_time: 20.297129 Lock_time: 0.000000 Rows_sent: 1 Rows_examined: 0
SET timestamp=1654794170;
SELECT GET_LOCK(‘Apache-Session-61f4f80baf667877ebc5d7dc764cf7b9’, 3600);
Time: 220609 22:49:55
User@Host: ticket3[ticket3] @ localhost []
Query_time: 53.304985 Lock_time: 0.000000 Rows_sent: 1 Rows_examined: 0
SET timestamp=1654804195;
SELECT GET_LOCK(‘Apache-Session-61f4f80baf667877ebc5d7dc764cf7b9’, 3600);
Time: 220609 22:55:49
User@Host: ticket3[ticket3] @ localhost []
Query_time: 9.890168 Lock_time: 0.000000 Rows_sent: 1 Rows_examined: 0
SET timestamp=1654804549;
SELECT GET_LOCK(‘Apache-Session-61f4f80baf667877ebc5d7dc764cf7b9’, 3600);
User@Host: ticket3[ticket3] @ localhost []
Query_time: 9.892621 Lock_time: 0.000000 Rows_sent: 1 Rows_examined: 0
SET timestamp=1654804549;
SELECT GET_LOCK(‘Apache-Session-61f4f80baf667877ebc5d7dc764cf7b9’, 3600);
Time: 220609 23:02:30
User@Host: ticket3[ticket3] @ localhost []
Query_time: 6.369261 Lock_time: 0.000000 Rows_sent: 1 Rows_examined: 0
SET timestamp=1654804950;
SELECT GET_LOCK(‘Apache-Session-61f4f80baf667877ebc5d7dc764cf7b9’, 3600);
User@Host: ticket3[ticket3] @ localhost []
Query_time: 6.353503 Lock_time: 0.000000 Rows_sent: 1 Rows_examined: 0
SET timestamp=1654804950;
SELECT GET_LOCK(‘Apache-Session-61f4f80baf667877ebc5d7dc764cf7b9’, 3600);
Time: 220609 23:04:58
User@Host: ticket3[ticket3] @ localhost []
Query_time: 13.219035 Lock_time: 0.000000 Rows_sent: 1 Rows_examined: 0
SET timestamp=1654805098;
SELECT GET_LOCK(‘Apache-Session-61f4f80baf667877ebc5d7dc764cf7b9’, 3600);
Time: 220609 23:06:01
User@Host: ticket3[ticket3] @ localhost []
Query_time: 76.154003 Lock_time: 0.000000 Rows_sent: 1 Rows_examined: 0
SET timestamp=1654805161;
SELECT GET_LOCK(‘Apache-Session-61f4f80baf667877ebc5d7dc764cf7b9’, 3600);
Time: 220609 23:08:39
User@Host: ticket3[ticket3] @ localhost []
Query_time: 21.445296 Lock_time: 0.000000 Rows_sent: 1 Rows_examined: 0
SET timestamp=1654805319;
SELECT GET_LOCK(‘Apache-Session-61f4f80baf667877ebc5d7dc764cf7b9’, 3600);
Time: 220609 23:20:27
User@Host: ticket3[ticket3] @ localhost []
Query_time: 69.223017 Lock_time: 0.000000 Rows_sent: 1 Rows_examined: 0
SET timestamp=1654806027;
SELECT GET_LOCK(‘Apache-Session-61f4f80baf667877ebc5d7dc764cf7b9’, 3600);
Time: 220609 23:24:04
User@Host: ticket3[ticket3] @ localhost []
Query_time: 50.787843 Lock_time: 0.000000 Rows_sent: 1 Rows_examined: 0
SET timestamp=1654806244;
SELECT GET_LOCK(‘Apache-Session-61f4f80baf667877ebc5d7dc764cf7b9’, 3600);
Time: 220609 23:33:52
User@Host: ticket3[ticket3] @ localhost []
Query_time: 217.481081 Lock_time: 0.000000 Rows_sent: 1 Rows_examined: 0
SET timestamp=1654806832;
SELECT GET_LOCK(‘Apache-Session-61f4f80baf667877ebc5d7dc764cf7b9’, 3600);
Time: 220609 23:38:53
User@Host: ticket3[ticket3] @ localhost []
Query_time: 318.488783 Lock_time: 0.000000 Rows_sent: 1 Rows_examined: 0
SET timestamp=1654807133;
SELECT GET_LOCK(‘Apache-Session-61f4f80baf667877ebc5d7dc764cf7b9’, 3600);
Time: 220610 1:03:18
User@Host: root[root] @ localhost []
Query_time: 136.690963 Lock_time: 0.000000 Rows_sent: 74513 Rows_examined: 74513
SET timestamp=1654812198;
SELECT /*!40001 SQL_NO_CACHE */ * FROM Attachments;
Time: 220610 1:03:32
User@Host: root[root] @ localhost []
Query_time: 7.214361 Lock_time: 0.000000 Rows_sent: 651890 Rows_examined: 651890
SET timestamp=1654812212;
SELECT /*!40001 SQL_NO_CACHE */ * FROM Transactions;
Time: 220610 1:09:55
User@Host: root[root] @ localhost []
Query_time: 382.417461 Lock_time: 0.000000 Rows_sent: 224335 Rows_examined: 224335
SET timestamp=1654812595;
SELECT /*!40001 SQL_NO_CACHE */ * FROM sessions;
Time: 220610 10:10:43
User@Host: ticket3[ticket3] @ localhost []
Query_time: 15.757929 Lock_time: 0.000000 Rows_sent: 1 Rows_examined: 0
SET timestamp=1654845043;
SELECT GET_LOCK(‘Apache-Session-4decd58389c6f4ebad98d6a7bee636c4’, 3600);
Time: 220610 10:13:05
User@Host: ticket3[ticket3] @ localhost []
Query_time: 14.806660 Lock_time: 0.000000 Rows_sent: 1 Rows_examined: 0
SET timestamp=1654845185;
SELECT GET_LOCK(‘Apache-Session-4decd58389c6f4ebad98d6a7bee636c4’, 3600);
As it turned out, we also have Centos 32 bit.
Judging by the logging, there are suspicions that MPM Prefork is configured incorrectly. Help optimize.
Are there any suggestions?
Hey there, sorry I was away for work ![]()
If I understand your ESXi screenshot correctly, your ESXi host has 4 CPU cores ? Does it have hyperthreading enabled to provide up to 8 logical processors?
How many vCPUs does the router_os VM have? I can see from that screenshot it’s consuming a high amount of CPU. The phenomenon of High CPU Ready in VMware can reveal itself as low CPU utilization on the underlying hypervisor/hardware. The reason is due to scheduling of vCPUs to pCPUs (physical), and in the case of multiple vCPUs, the hypervisor must reserve the same number of pCPUs to schedule even a single time-slice of processing. For hardware with a low logical processor count, it’s very easy to monopolise the hardware by a single busy VM with multiple vCPUs.
A very old article about it here:
Let me know how you go.